Scikit-Learn

0

Scikit-Learn介绍

  Scikit-Learn库自2007年发布以来,已经称为最受欢迎的机器学习库之一,基于广受欢迎的Numpy和Scipy库构建,能够提供用于机器学习的算法,数据预处理等功能。

Scikit-Learn应用

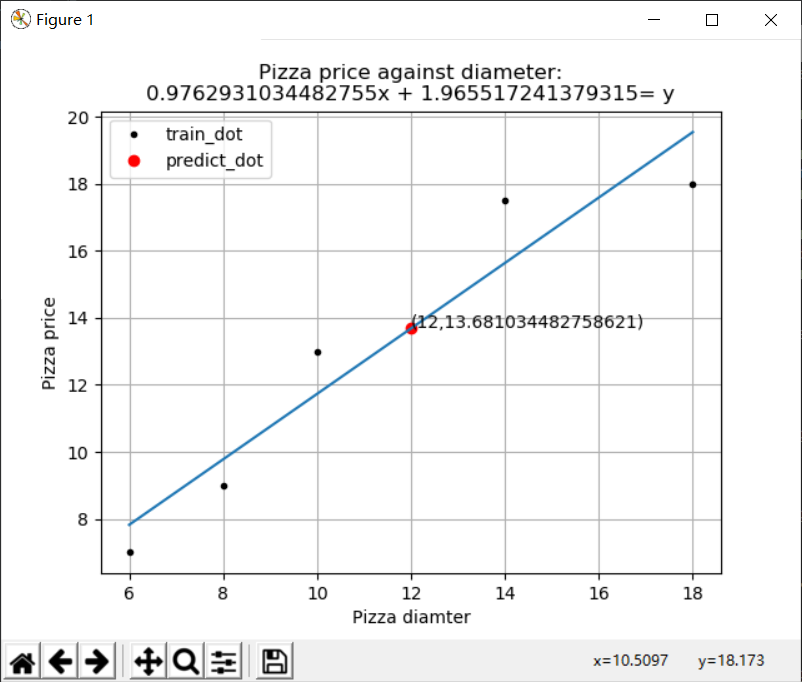
Scikit-Learn线性回归

1
2
3
4
5
6
7
8
9
10
11
12
13
14
15
16
17
18
19
20
21
22
23
24
25
26
27
28
29
30
31
32
33
34
35
36
37
38
import numpy as np
import matplotlib.pyplot as plt
from sklearn.linear_model import LinearRegression

x_train = np.array([[6], [8], [10], [14], [18]]).reshape(-1, 1)
y_train = np.array([7, 9, 13, 17.5, 18])

# model = LinearRegression() 创建线性回归模型
model = LinearRegression()

# model.fit(X, y) 用训练数据X,y拟合模型
model.fit(x_train, y_train)

x_test = np.array([[12]]).reshape(-1, 1)

# model.predict(X) 用训练后的模型预测数据X
y_test = model.predict(x_test)[0]

x_max, x_min = max(x_train), min(x_train)
y_max, y_min = model.predict([x_max, x_min])

# model.coef_ 获取模型的权值系数
k = model.coef_[0]
x_mean, y_mean = np.mean(x_train), np.mean(y_train)
b = y_mean - k * x_mean

plt.figure()
plt.title('Pizza price against diameter:\n' + str(k) + 'x + ' + str(b) + '= y')
plt.xlabel('Pizza diamter')
plt.ylabel('Pizza price')
plt.plot(x_train, y_train, 'k.', label='train_dot')
plt.plot(x_test, y_test, 'ro', label='predict_dot')
plt.plot([x_max, x_min], [y_max, y_min])
plt.text(x_test, y_test, '(' + str(x_test[0][0]) + ',' + str(y_test) + ')')
plt.legend()
plt.grid(True)
plt.style.use('ggplot')
plt.show()

1

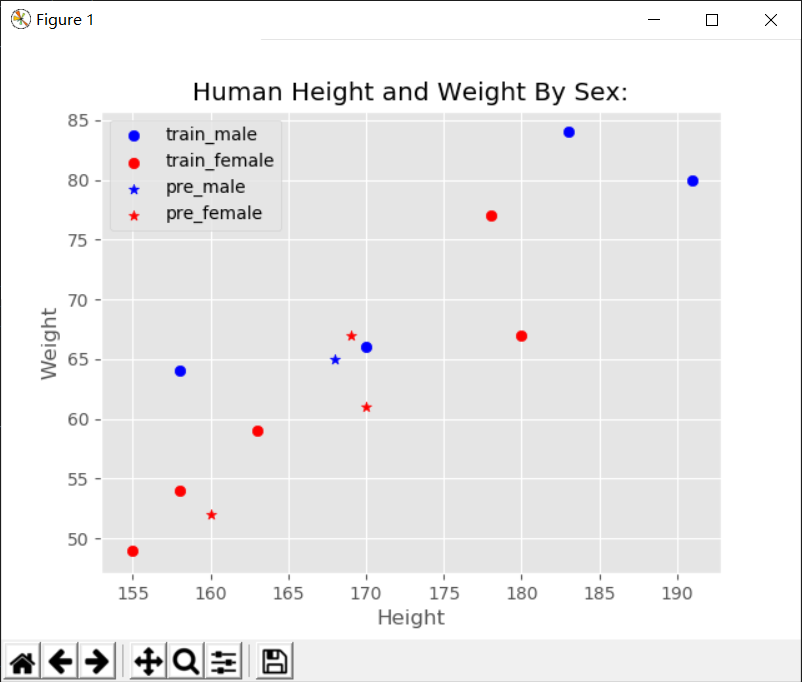
Scikit-LearnK近邻分类算法

1
2
3
4
5
6
7
8
9
10
11
12
13
14
15
16
17
18
19
20
21
22
23
24
25
26
27
28
29
30
31
32
33
34
35
36
37
38
39
40
41
42
43
44
45
46
47
48
49
50
51
52
53
54
55
56
57
58
59
60
61
62
63
64
65
66
67
68
69
70
71
72
73
74
75
76
77
78
79
80
81
82
83
84
85
import numpy as np
import matplotlib.pyplot as plt
from sklearn.preprocessing import LabelBinarizer
from sklearn.neighbors import KNeighborsClassifier
from sklearn.metrics import accuracy_score
from sklearn.metrics import precision_score
from sklearn.metrics import recall_score
from sklearn.metrics import f1_score
from sklearn.metrics import matthews_corrcoef
from sklearn.metrics import classification_report

def classify(x, y):
male_height, male_weight, female_height, female_weight = [], [], [], []
for i in range(len(x)):
if y[i] == 'male':
male_height.append(x[i][0])
male_weight.append(x[i][1])
else:
female_height.append(x[i][0])
female_weight.append(x[i][1])
return male_height, male_weight, female_height, female_weight

x_train = np.array([[158, 64], [170, 66], [183, 84], [191, 80], [155, 49], [163, 59], [180, 67], [158, 54], [178, 77]])
y_train = ['male', 'male', 'male', 'male', 'female', 'female', 'female', 'female', 'female']

# lb = LabelBinarizer() 创建一个标签转换器接口,将标签变成整数
lb = LabelBinarizer()

# lb.fit_transform(y) 在训练数据集上对标签进行拟合并转换为整数
y_train_binarized = lb.fit_transform(y_train)

k = 3

# clf = KNeighborsClassifier(n_neighbors=k) 创建KNN分类器模型
clf = KNeighborsClassifier(n_neighbors=k)

# clf.fit(X, y) 用训练数据X,y拟合模型
clf.fit(x_train,y_train_binarized.reshape(-1))

x_test = np.array([[168, 65], [170, 61], [160, 52], [169, 67]])
y_test = ['male', 'male', 'female', 'female']

# clf.predict(X) 用训练后的模型预测数据X
y_pre_binarized = clf.predict(x_test)

# lb.inverse_transform(Y) 将预测后的整数转换成标签
y_pre = lb.inverse_transform(y_pre_binarized)

male_height_train, male_weight_train, female_height_train, female_weight_train = classify(x_train, y_train)
male_height_pre, male_weight_pre, female_height_pre, female_weight_pre = classify(x_test, y_pre)

y_test_binarized = lb.transform(y_test).T[0]
print(y_test_binarized)
print(y_pre_binarized)

# accuracy_score(y_test, y_predict) 求真实值与预测值的准确率
print('预测准确率为:%.2f' %accuracy_score(y_test_binarized, y_pre_binarized))

# precision_score(y_test, y_predict) 求真实值与预测值的精准率
print('预测精准率为:%.2f' %precision_score(y_test_binarized, y_pre_binarized))

# recall_score(y_test, y_predict) 求真实值与预测值的召回率
print('预测召回率为:%.2f' %recall_score(y_test_binarized, y_pre_binarized))

# f1_score(y_test, y_predict) 求真实值与预测值的F1得分
print('预测F1得分为:%.2f' %f1_score(y_test_binarized, y_pre_binarized))

# matthews_corrcoef(y_test, y_predict) 求真实值与预测值的马修斯系数
print('马修斯系数为:%.2f' %matthews_corrcoef(y_test_binarized, y_pre_binarized))

# classification_report(y_test, y_predict, target_names=None, labels=None) 同时生成真实值与预测值的精准率,召回率和F1得分,目标标签为target_name,对应的值为label
print(classification_report(y_test_binarized, y_pre_binarized, target_names={'male'}, labels=[1]))

plt.style.use('ggplot')
plt.figure()
plt.title('Human Height and Weight By Sex:')
plt.xlabel('Height')
plt.ylabel('Weight')
plt.grid(True)
plt.scatter(male_height_train, male_weight_train, color='b', marker='o', label='train_male')
plt.scatter(female_height_train, female_weight_train, color='r', marker='o', label='train_female')
plt.scatter(male_height_pre, male_weight_pre, color='b', marker='*', label='pre_male')
plt.scatter(female_height_pre, female_weight_pre, color='r', marker='*', label='pre_female')
plt.legend()
plt.show()

2

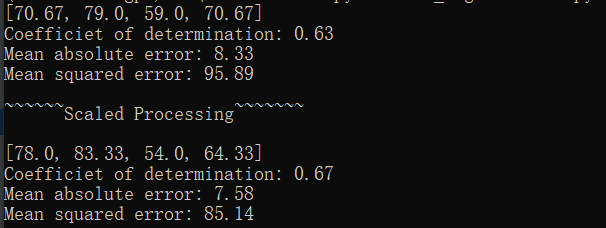
Scikit-LearnK近邻回归算法

1
2
3
4
5
6
7
8
9
10
11
12
13
14
15
16
17
18
19
20
21
22
23
24
25
26
27
28
29
30
31
32
33
34
35
36
37
38
39
40
41
42
43
44
45
46
47
48
49
50
import numpy as np
from sklearn.neighbors import KNeighborsRegressor
from sklearn.metrics import mean_absolute_error, mean_squared_error, r2_score
from sklearn.preprocessing import StandardScaler

x_train = np.array([[158, 1], [170, 1], [183, 1], [191, 1], [155, 0], [163, 0], [180, 0], [158, 0], [170, 0]])
y_train = np.array([64, 86, 84, 80, 49, 59, 67, 54, 67])
x_test = np.array([[168, 1], [180, 1], [160, 0], [169, 0]])
y_test = [65, 96, 52, 67]
k = 3

# clf = KNeighborsRegressor(n_neighbors=k) 创建KNN回归模型
clf = KNeighborsRegressor(n_neighbors=k)

# clf.fit(X, y) 用训练数据X,y拟合模型
clf.fit(x_train, y_train)

# clf.predict(X) 用训练后的模型预测数据X
pre = clf.predict(x_test)

print([np.around(x, 2) for x in pre])

# r2_score(y_test, y_predict) 求真实值与预测值的决定系数
print('Coefficiet of determination: %.2f' %r2_score(y_test, pre))

# mean_absolute_erro(y_test, y_predict) 求真实值与预测值的平均绝对误差MAE
print('Mean absolute error: %.2f' %mean_absolute_error(y_test, pre))

# mean_squared_error(y_test, y_predict) 求真实值与预测值的均方误差MSE
print('Mean squared error: %.2f' %mean_squared_error(y_test, pre))

print('\n' + 'Scaled Processing'.center(30, '~') + '\n')

# ss = StandardScaler() 创建一个特征缩放转换接口
ss = StandardScaler()

# ss.fit_transform(x) 在训练数据集上对数据特征进行缩放
x_train_scaled = ss.fit_transform(x_train)

# ss.transform(x) 在测试数据集上对数据特征进行缩放
x_test_scaled = ss.transform(x_test)

clf.fit(x_train_scaled, y_train)

pre_scaled = clf.predict(x_test_scaled)

print([np.around(x, 2) for x in pre_scaled])
print('Coefficiet of determination: %.2f' %r2_score(y_test, pre_scaled))
print('Mean absolute error: %.2f' %mean_absolute_error(y_test, pre_scaled))
print('Mean squared error: %.2f' %mean_squared_error(y_test, pre_scaled))

3

Scikit-Learn独热编码

1
2
3
4
5
6
7
8
9
10
11
from sklearn.feature_extraction import DictVectorizer

# onehot_encoder = DictVectorizer() 创建独热编码转换器
onehot_encoder = DictVectorizer()

x = [{'city': 'New York'}, {'city': 'San Francisco'}, {'city:': 'Chapel Hill'}]

# onehot_encoder.fit_transform(x).toarray() 将字典的值value进行独热编码
onehot_x = onehot_encoder.fit_transform(x).toarray()

print(onehot_x)

4

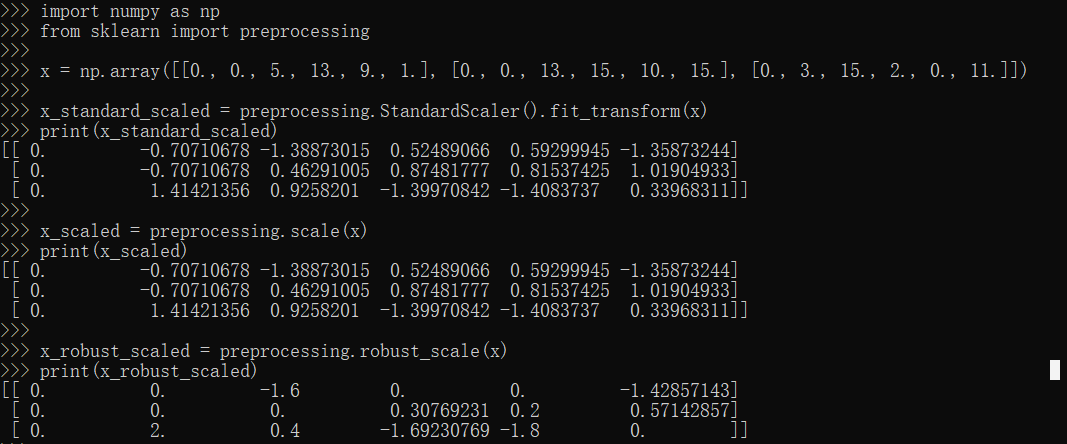
Scikit-Learn特征标准化

1
2
3
4
5
6
7
8
9
10
11
12
13
14
15
16
import numpy as np
from sklearn import preprocessing

x = np.array([[0., 0., 5., 13., 9., 1.], [0., 0., 13., 15., 10., 15.], [0., 3., 15., 2., 0., 11.]])

# preprocessing.StandardScaler().fit_transform(x) 使用标准化转换器类函数
x_standard_scaled = preprocessing.StandardScaler().fit_transform(x)
print(x_standard_scaled)

# preprocessing.scale(x) 使用标准化函数scale
x_scaled = preprocessing.scale(x)
print(x_scaled)

# preprocessing.robust_scale(x) 使用鲁棒性标准化函数robust_scale
x_robust_scaled = preprocessing.robust_scale(x)
print(x_robust_scaled)

5

Scikit-Learn多元线性回归

1
2
3
4
5
6
7
8
9
10
11
12
13
14
15
16
17
18
19
20
21
22
from sklearn.linear_model import LinearRegression

x = [[6, 2], [8, 1], [10, 0], [14, 2], [18, 0]]
y = [[7], [9], [13], [17.5], [18]]

# model = LinearRegression() 创建线性回归模型
model = LinearRegression()

# model.fit(X, y) 用训练数据X,y拟合模型
model.fit(x, y)

x_test = [[8, 2], [9, 0], [11, 2], [16, 2], [12, 0]]
y_test = [[11], [8.5], [15], [18], [11]]

# model.predict(X) 用训练后的模型预测数据X
predictions = model.predict(x_test)

for i, prediction in enumerate(predictions):
print('prediction: %s, truth: %s' %(prediction, y_test[i]))

# model.score(x, y) 求模型的决定系数
print('R-squared: %.2f' %model.score(x_test, y_test))

6

Scikit-Learn多项式回归

1
2
3
4
5
6
7
8
9
10
11
12
13
14
15
16
17
18
19
20
21
22
23
24
25
26
27
28
29
30
31
32
33
34
35
36
37
38
39
40
41
42
43
44
45
46
47
48
49
50
51
52
53
54
55
56
57
58
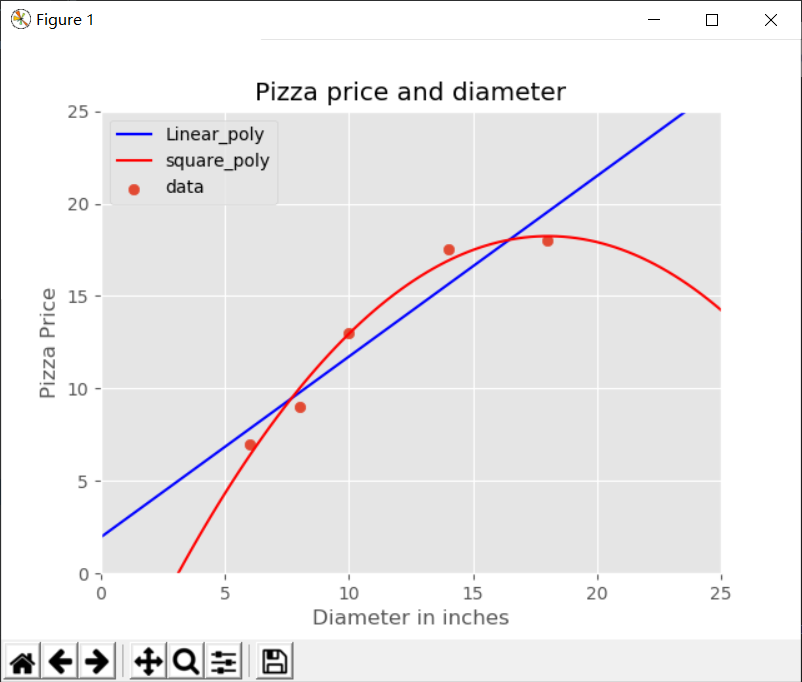
import numpy as np
import matplotlib.pyplot as plt
from sklearn.linear_model import LinearRegression
from sklearn.preprocessing import PolynomialFeatures

plt.style.use('ggplot')

x_train = [[6], [8], [10], [14], [18]]
y_train = [[7], [9], [13], [17.5], [18]]
x_test = [[6], [8], [11], [16]]
y_test = [[8], [12], [15], [18]]

# model = LinearRegression() 创建线性回归模型
regressor = LinearRegression()

# model.fit(X, y) 用训练数据X,y拟合模型
regressor.fit(x_train, y_train)

xx = np.linspace(0, 26, 100)

# model.predict(X) 用训练后的模型预测数据X
yy = regressor.predict(xx.reshape(xx.shape[0], 1))

plt.plot(xx, yy, c='b', label='Linear_poly')

# quadratic_featurizer = PolynomialFeatures(degree=n) 创建n阶多项式转换器
quadratic_featurizer = PolynomialFeatures(degree=2)

# quadratic_featurizer.fit_transform(x_train) 在训练数据集上对数据特征进行多项式变换
x_train_quadratic = quadratic_featurizer.fit_transform(x_train)

# ss.fit_transform(x) 在训练数据集上对数据特征进行多项式变换
x_test_quadratic = quadratic_featurizer.transform(x_test)

# model = LinearRegression() 创建线性回归模型
regressor_quadratic = LinearRegression()

# model.fit(X, y) 用训练数据X,y拟合模型
regressor_quadratic.fit(x_train_quadratic, y_train)

# ss.fit_transform(x) 对数据特征进行多项式变换
xx_quadratic = quadratic_featurizer.transform(xx.reshape(xx.shape[0], 1))

# model.predict(X) 用训练后的模型预测数据X
yy_quadratic = regressor_quadratic.predict(xx_quadratic)

print('linear regression r-squared', regressor.score(x_test, y_test))
print('quadratic regression r-squared', regressor_quadratic.score(x_test_quadratic, y_test))

plt.plot(xx, yy_quadratic, c='r', label='square_poly')
plt.scatter(x_train, y_train, label='data')
plt.axis([0, 25, 0, 25])
plt.title('Pizza price and diameter')
plt.xlabel('Diameter in inches')
plt.ylabel('Pizza Price')
plt.grid(True)
plt.legend()
plt.show()

7

Scikit-Learn逻辑回归和朴素贝叶斯

1
2
3
4
5
6
7
8
9
10
11
12
13
14
15
16
17
18
19
20
21
22
23
24
25
26
27
28
29
30
31
32
33
34
35
36
37
38
39
40
41
42
43
44
45
from sklearn.datasets import load_breast_cancer
from sklearn.linear_model import LogisticRegression
from sklearn.naive_bayes import GaussianNB
from sklearn.model_selection import train_test_split
import matplotlib.pyplot as plt

# from sklearn.datasets import load_breast_cancer 从sklearn数据集中导入胸部癌症的数据
x, y = load_breast_cancer(return_X_y=True)

# train_test_split(x, y, stratify=y, test_size=n) 将x和y按照test_size划分成数据集和测试集,stratify=y按照y中的比例分配
x_train, x_test, y_train, y_test = train_test_split(x, y, stratify=y, test_size=0.2, random_state=31)

# lr = LogisticRegression() 创建逻辑回归模型
lr = LogisticRegression(solver='liblinear')

# nb = GaussianNB() 创建朴素贝叶斯模型
nb = GaussianNB()

lr_scores = []
nb_scores = []

train_sizes = range(10, len(x_train), 25)
for train_size in train_sizes:
# train_test_split(x, y, stratify=y, train_size=n) 将x和y按照test_size划分成数据集和测试集,stratify=y按照y中的比例分配
x_slice, _, y_slice, _ = train_test_split(x_train, y_train, train_size=train_size, stratify=y_train, random_state=31)

# nb.fit(X, y) 用训练数据X,y拟合朴素贝叶斯模型
nb.fit(x_slice, y_slice)

# nb.score(x, y) 求朴素贝叶斯模型的决定系数
nb_scores.append(nb.score(x_test, y_test))

# lr.fit(X, y) 用训练数据X,y拟合逻辑回归模型
lr.fit(x_slice, y_slice)

# lr.score(x, y) 求逻辑回归模型的决定系数
lr_scores.append(lr.score(x_test, y_test))

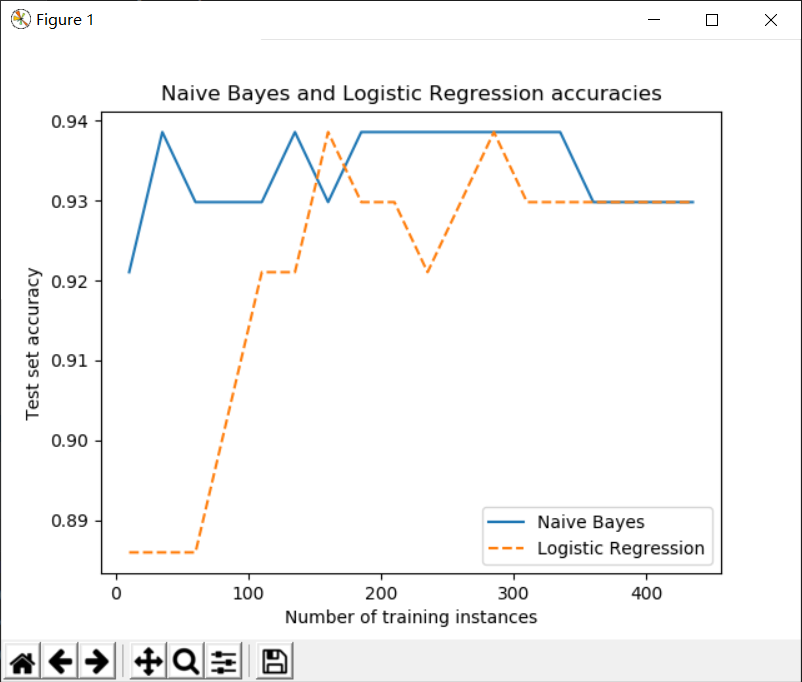
plt.plot(train_sizes, nb_scores, label='Naive Bayes')
plt.plot(train_sizes, lr_scores, linestyle='--', label='Logistic Regression')
plt.title('Naive Bayes and Logistic Regression accuracies')
plt.xlabel('Number of training instances')
plt.ylabel('Test set accuracy')
plt.legend()
plt.show()

8

Scikit-Learn决策树和袋装集成学习

1
2
3
4
5
6
7
8
9
10
11
12
13
14
15
16
17
18
19
20
21
22
23
24
25
26
27
28
29
30
31
32
33
34
35
from sklearn.tree import DecisionTreeClassifier
from sklearn.ensemble import RandomForestClassifier
from sklearn.datasets import make_classification
from sklearn.model_selection import train_test_split
from sklearn.metrics import classification_report

# from sklearn.datasets import make_classification 从sklearn数据集中导入make_classification用于创建分类数据集,样本数为n_samples,特征数为n_features,有用的特征数为n_informative,每一类的簇的个数为n_clusters_per_class
x, y = make_classification(n_samples=1000, n_features=100, n_informative=20, n_clusters_per_class=2, random_state=11)

# train_test_split(x, y) 将x和y划分成数据集和测试集
x_train, x_test, y_train, y_test = train_test_split(x, y, random_state=11)

# clf = DecisionTreeClassifier() 创建决策树模型
clf = DecisionTreeClassifier(random_state=11)

# clf.fit(X, y) 用训练数据X,y拟合模型
clf.fit(x_train, y_train)

# clf.predict(X) 用训练后的模型预测数据X
predictions = clf.predict(x_test)

# classification_report(y_test, y_predict, target_names=None, labels=None) 同时生成真实值与预测值的精准率,召回率和F1得分,目标标签为target_name,对应的值为label
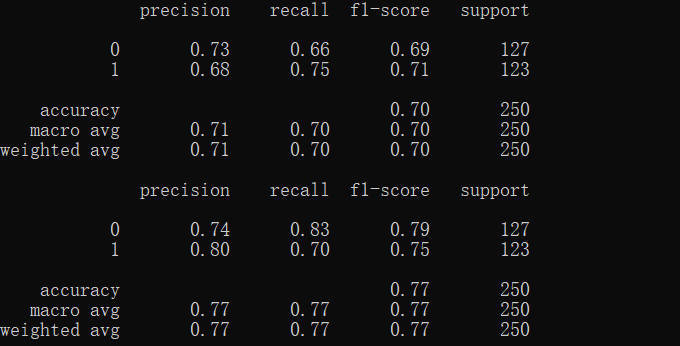
print(classification_report(y_test, predictions))

# clf = RandomForestClassifier(n_estimators=n) 创建包含n个树的随机森林分类器
clf = RandomForestClassifier(n_estimators=10, random_state=11)

# clf.fit(X, y) 用训练数据X,y拟合模型
clf.fit(x_train, y_train)

# clf.predict(X) 用训练后的模型预测数据X
predictions = clf.predict(x_test)

# classification_report(y_test, y_predict, target_names=None, labels=None) 同时生成真实值与预测值的精准率,召回率和F1得分,目标标签为target_name,对应的值为label
print(classification_report(y_test, predictions))

9

Scikit-Learn推进集成学习

1
2
3
4
5
6
7
8
9
10
11
12
13
14
15
16
17
18
19
20
21
22
23
24
25
26
27
28
29
30
31
32
33
34
from sklearn.ensemble import AdaBoostClassifier
from sklearn.tree import DecisionTreeClassifier
from sklearn.datasets import make_classification
from sklearn.model_selection import train_test_split
import matplotlib.pyplot as plt

# from sklearn.datasets import make_classification 从sklearn数据集中导入make_classification用于创建分类数据集,样本数为n_samples,特征数为n_features,有用的特征数为n_informative,每一类的簇的个数为n_clusters_per_class
x, y = make_classification(n_samples=1000, n_features=50, n_informative=30, n_clusters_per_class=3, random_state=11)

# train_test_split(x, y) 将x和y划分成数据集和测试集
x_train, x_test, y_train, y_test = train_test_split(x, y, random_state=11)

# clf = DecisionTreeClassifier() 创建决策树模型
clf = DecisionTreeClassifier()

# clf.fit(X, y) 用训练数据X,y拟合模型
clf.fit(x_train, y_train)

# clf.score(x, y) 求模型的决定系数
print('DecisionTree accuracy:%s' %clf.score(x_test, y_test))

# clf = AdaBoostClassifier(n_estimators=n) 创建具有n个弱学习器的AdaBoost模型
clf = AdaBoostClassifier(n_estimators=50, random_state=11)

# clf.fit(X, y) 用训练数据X,y拟合模型
clf.fit(x_train, y_train)

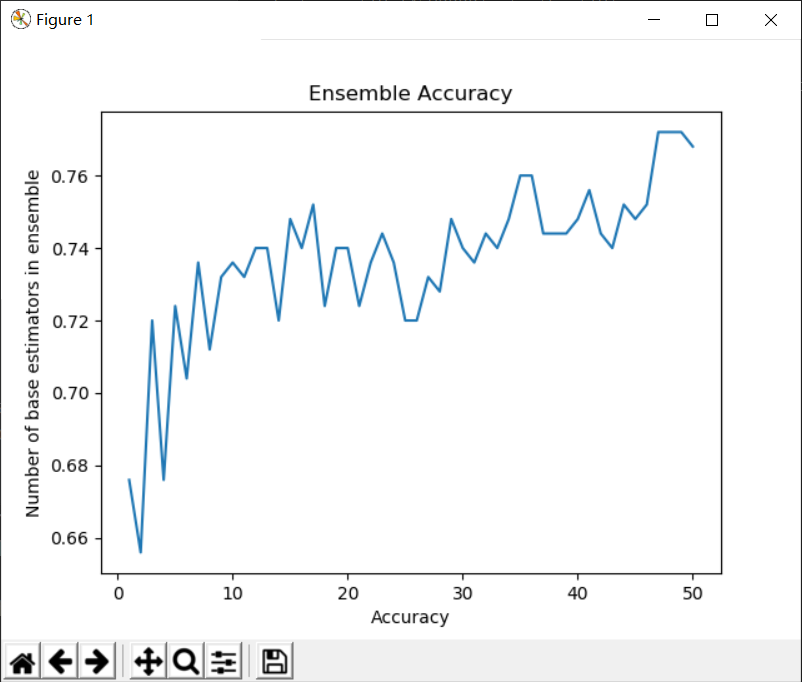
plt.title('Ensemble Accuracy')
plt.xlabel('Accuracy')
plt.ylabel('Number of base estimators in ensemble')

# clf.staged_score(x, y) 求AdaBoost模型的弱分类器个数的决定系数
plt.plot(range(1, 51), [accuracy for accuracy in clf.staged_score(x_test, y_test)])
plt.show()

10

Scikit-Learn感知机

1
2
3
4
5
6
7
8
9
10
11
12
13
14
15
16
17
18
19
20
21
22
from sklearn.datasets import make_classification
from sklearn.model_selection import train_test_split
from sklearn.metrics import classification_report
from sklearn.linear_model import Perceptron

# from sklearn.datasets import make_classification 从sklearn数据集中导入make_classification用于创建分类数据集,样本数为n_samples,特征数为n_features,有用的特征数为n_informative,每一类的簇的个数为n_clusters_per_class
x, y = make_classification(n_samples=1000, n_features=100, n_informative=20, n_clusters_per_class=2, random_state=11)

# train_test_split(x, y) 将x和y划分成数据集和测试集
x_train, x_test, y_train, y_test = train_test_split(x, y, random_state=11)

# clf = Perceptron() 创建感知机模型
clf = Perceptron(random_state=11)

# clf.fit(X, y) 用训练数据X,y拟合模型
clf.fit(x_train, y_train)

# clf.predict(X) 用训练后的模型预测数据X
predictions = clf.predict(x_test)

# classification_report(y_test, y_predict, target_names=None, labels=None) 同时生成真实值与预测值的精准率,召回率和F1得分,目标标签为target_name,对应的值为label
print(classification_report(y_test, predictions))

11

Scikit-Learn支持向量机

1
2
3
4
5
6
7
8
9
10
11
12
13
14
15
16
17
18
19
20
21
22
from sklearn.datasets import make_classification
from sklearn.model_selection import train_test_split
from sklearn.metrics import classification_report
from sklearn.svm import SVC

# from sklearn.datasets import make_classification 从sklearn数据集中导入make_classification用于创建分类数据集,样本数为n_samples,特征数为n_features,有用的特征数为n_informative,每一类的簇的个数为n_clusters_per_class
x, y = make_classification(n_samples=1000, n_features=100, n_informative=20, n_clusters_per_class=2, random_state=11)

# train_test_split(x, y) 将x和y划分成数据集和测试集
x_train, x_test, y_train, y_test = train_test_split(x, y, random_state=11)

# clf = SVC(kernel='rbf', gamma='auto deprecated', C=1.0) 创建支持向量机模型,核函数默认为rbf高斯核,正则化参数C默认为1.0,核系数参数gamma默认为不使用
clf = SVC(kernel='rbf', gamma=0.01, C=100, random_state=11)

# clf.fit(X, y) 用训练数据X,y拟合模型
clf.fit(x_train, y_train)

# clf.predict(X) 用训练后的模型预测数据X
predictions = clf.predict(x_test)

# classification_report(y_test, y_predict, target_names=None, labels=None) 同时生成真实值与预测值的精准率,召回率和F1得分,目标标签为target_name,对应的值为label
print(classification_report(y_test, predictions))

12

Scikit-Learn多层感知机

1
2
3
4
5
6
7
8
9
10
11
12
13
14
from sklearn.datasets import load_digits
from sklearn.model_selection import cross_val_score
from sklearn.neural_network.multilayer_perceptron import MLPClassifier

# from sklearn.datasets import load_digits 从sklearn数据集中导入手写数字的数据
digits = load_digits()
x = digits.data
y = digits.target

# clf = MLPClassifier(hidden_layer_sizes=(100,), alpha=0.0001, max_iter=200, random_state=20) 创建多层感知机模型,每一层的神经元个数为hidden_layer_sizes,正则化参数alpha默认为0.0001,最大迭代次数默认为200
clf = MLPClassifier(hidden_layer_sizes=(150, 100), alpha=0.1, max_iter=500)

# cross_val_score(estimator, X, y, n_jobs=None, cv=n) n折交叉验证,估计器为estimator,数据为X和y,同时工作的CPU个数为1
print(cross_val_score(clf, x, y, n_jobs=-1, cv=5))

13

Scikit-LearnKmeans聚类

1
2
3
4
5
6
7
8
9
10
11
12
13
14
15
16
17
18
19
20
21
22
23
24
25
26
27
28
29
30
31
32
33
34
35
36
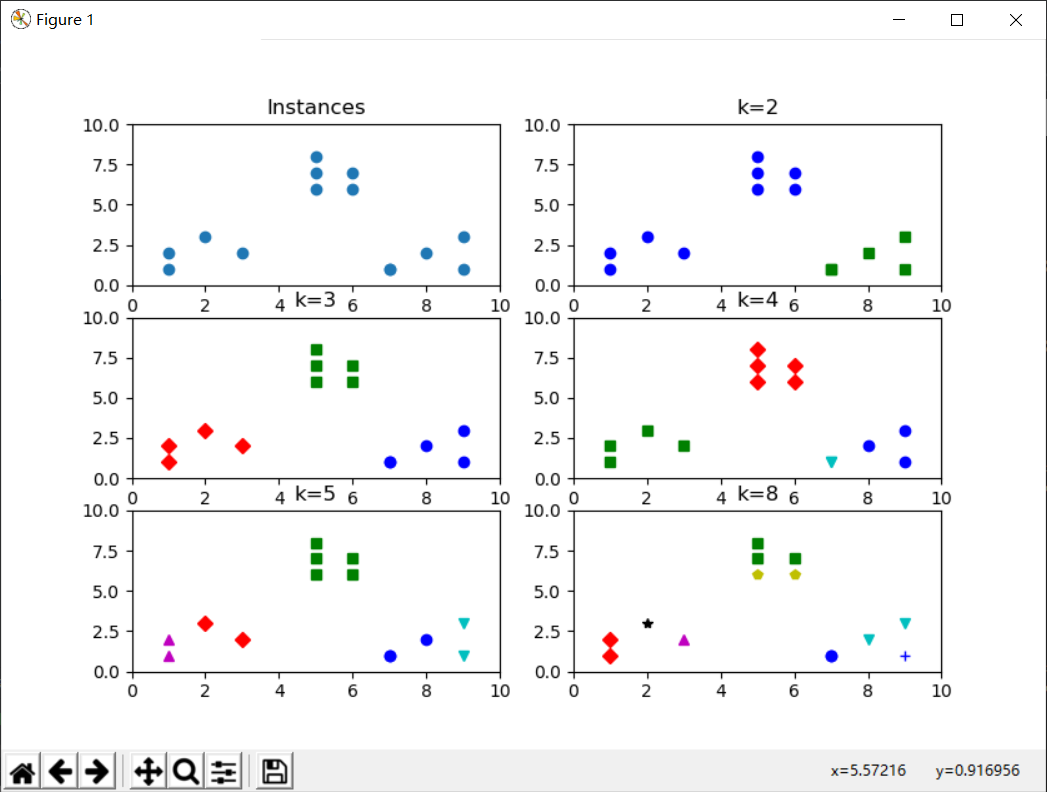
import numpy as np
from sklearn.cluster import KMeans
import matplotlib.pyplot as plt

plt.subplot(3, 2, 1)
x1 = np.array([1, 2, 3, 1, 5, 6, 5, 5, 6, 7, 8, 9, 7, 9])
x2 = np.array([1, 3, 2, 2, 8, 6, 7, 6, 7, 1, 2, 1, 1, 3])
x = np.vstack((x1, x2)).T
plt.xlim([0, 10])
plt.ylim([0, 10])
plt.title('Instances')
plt.scatter(x1, x2)

colors = ['b', 'g', 'r', 'c', 'm', 'y', 'k', 'b']
markers = ['o', 's', 'D', 'v', '^', 'p', '*', '+']
tests = [2, 3, 4, 5, 8]
subplot_counter = 1

for t in tests:
subplot_counter +=1
plt.subplot(3, 2, subplot_counter)

# kmeans_model = KMeans(n_clusters=n) 创建Kmeans模型,类别个数为n
kmeans_model = KMeans(n_clusters=t)

# kmeans_model.fit(x) 用训练数据X拟合模型
kmeans_model.fit(x)

for i, l in enumerate(kmeans_model.labels_):
plt.plot(x1[i], x2[i], color=colors[l], marker=markers[l])

plt.xlim([0, 10])
plt.ylim([0, 10])
plt.title('k=%s' %t)
plt.show()

14

Scikit-LearnPCA降维

1
2
3
4
5
6
7
8
9
10
11
12
13
14
15
16
17
18
19
20
21
22
23
24
25
26
27
28
29
30
31
32
33
import matplotlib.pyplot as plt
from sklearn.decomposition import PCA
from sklearn.datasets import load_iris

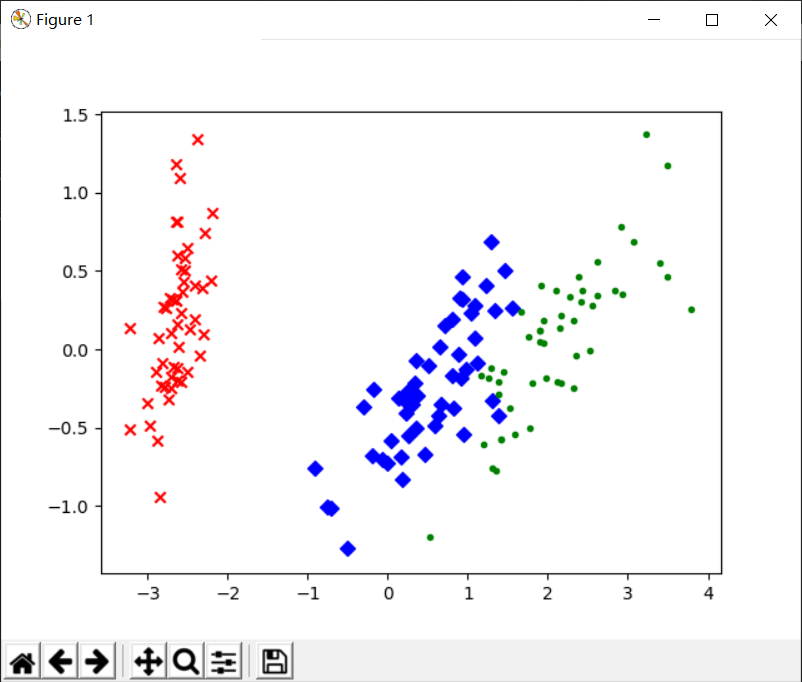
data = load_iris()
x = data.data
y = data.target

# pca = PCA(n_components=n) 创建n维PCA转换器
pca = PCA(n_components=2)

# pca.fit_transform(X) 在训练数据集进行PCA降维
reduced_x = pca.fit_transform(x)

red_x, red_y = [], []
blue_x, blue_y = [], []
green_x, green_y = [], []

for i in range(len(reduced_x)):
if y[i] == 0:
red_x.append(reduced_x[i][0])
red_y.append(reduced_x[i][1])
elif y[i] == 1:
blue_x.append(reduced_x[i][0])
blue_y.append(reduced_x[i][1])
else:
green_x.append(reduced_x[i][0])
green_y.append(reduced_x[i][1])

plt.scatter(red_x, red_y, c='r', marker='x')
plt.scatter(blue_x, blue_y, c='b', marker='D')
plt.scatter(green_x, green_y, c='g', marker='.')
plt.show()

15

Scikit-Learn小结

  由于Scikit-Learn集成了许多常用的机器学习算法,如决策树,SVM,多层感知机,Kmeans等,可以让使用者节约大量的时间。而且其拥有很好的官方文档,让开发者,研究者可以方便的入门和使用。因此Scikit-Learn在机器学习领域受到广大使用者的喜爱。

-------------本文结束感谢您的阅读-------------
0%